Plot different aspects of a SpatSimObj
Arguments
- sim_object
A
SpatSimObj- nrow
Number of rows of plots (only applicable when more than one plot is made)
- ncol
Number of columns of plots (only applicable when more than one plot is made)
- which
Index of the elements of the SpatSimObj to be plotted
- what
What to plot ("tissue heatmap", "hole heatmap", or "whole core")
Details
The PlotSimulation function is used to plot different aspects of a SpatSimObj
The function takes a sim_object as its first argument, which should be an object of class
"Spatial Simulation Object". The function can then be used to plot different aspects of the
simulation, such as heatmaps of the tissue or holes, or a plot of the whole core with assigned cells colored by type.
When what is set to "tissue heatmap" or "hole heatmap", the function will plot heatmaps of
the specified tissue or hole. When what is set to "whole core", the function will plot the
entire core with assigned cells colored by type. Only a single element of the sim_object can
be plotted when what is set to "whole core". what equal to "tissue points", "hole points", or
"tissue hole points" will result in a point plot of the respective assignments on points.
When more than one plot is made, nrow and ncol can be used to specify the number of rows
and columns of the plot grid, respectively.
Examples
# create a SpatSimObj
sim_object <- CreateSimulationObject()
#> No `window` specified - defaulting to x (0, 10); y (0, 10)
sim_object = GenerateSpatialPattern(sim_object)
sim_object = GenerateTissue(sim_object, density_heatmap = TRUE, step_size = 1, cores = 1)
#> Computing density heatmap
#> Computing tissue probability
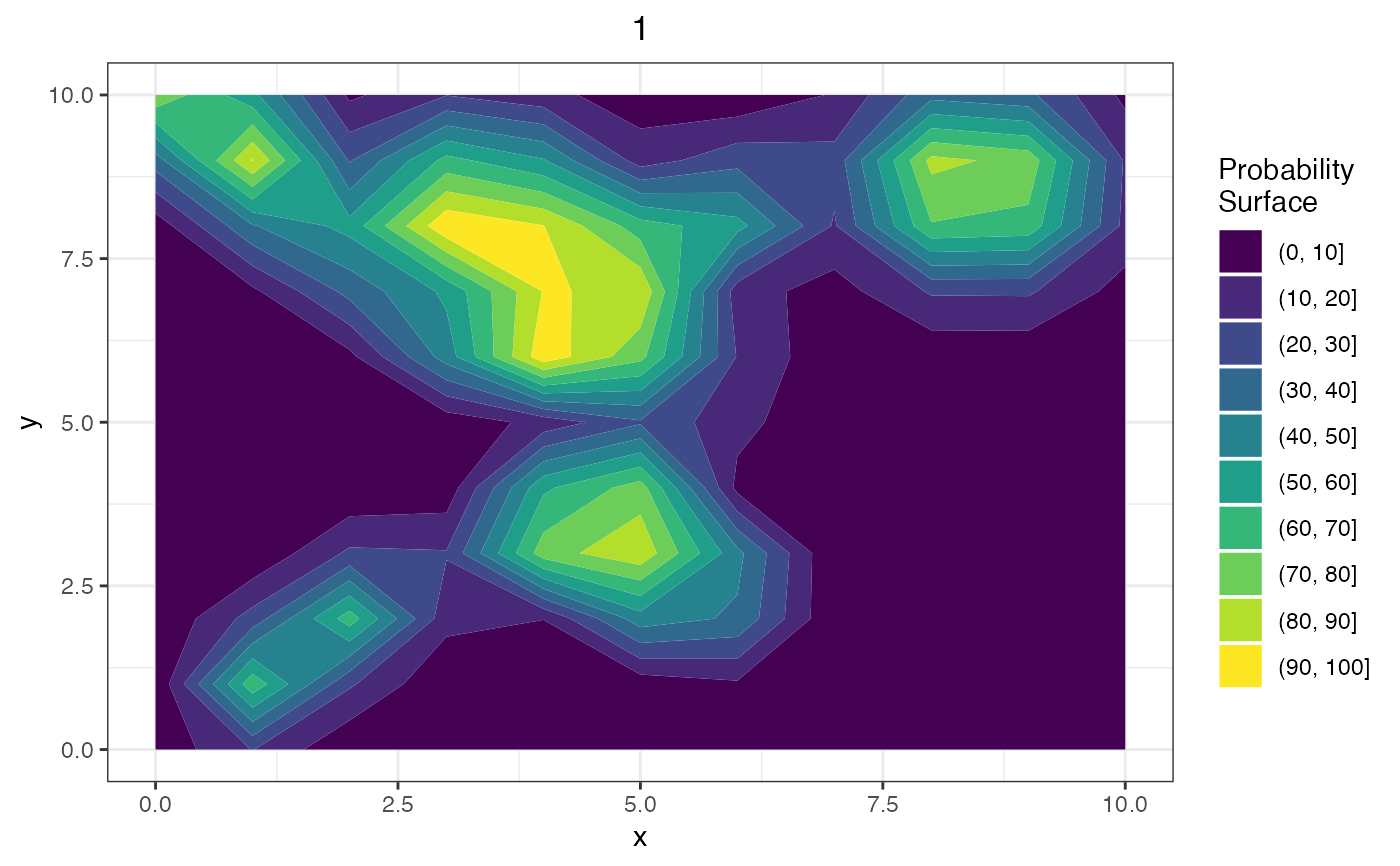
# plot a heatmap of tissue 1
PlotSimulation(sim_object, which = 1, what = "tissue heatmap")