This function generates plot of point process in rectangular or circular window.
plot_immunoflo(
  mif,
  plot_title,
  mnames,
  mcolors = NULL,
  cell_type = NULL,
  filename = NULL,
  path = NULL,
  xloc = NULL,
  yloc = NULL
)
Arguments
- mif
MIF object created using create_MIF().
- plot_title
Character string or vector of character strings of variable name(s) to serve as plot title(s).
- mnames
Character vector containing marker names.
- mcolors
Character vector of color names to display markers in the plot.
- cell_type
Character vector of cell type
- filename
Character string of file name to store plots. Plots are generated as single .pdf file.
- path
Different path than file name or to use in conjunction with filename ???
- xloc, yloc
columns in the spatial files containing the x and y locations of cells. Default is `NULL` which will result in `xloc` and `yloc` being calculated from `XMin`/`YMin` and `XMax`/`YMax`
Value
mif object and the ggplot objects can be viewed form the derived slot of the mif object
Examples
#Create mif object
library(dplyr)
x <- create_mif(clinical_data = example_clinical %>%
mutate(deidentified_id = as.character(deidentified_id)),
sample_data = example_summary %>%
mutate(deidentified_id = as.character(deidentified_id)),
spatial_list = example_spatial,
patient_id = "deidentified_id",
sample_id = "deidentified_sample")
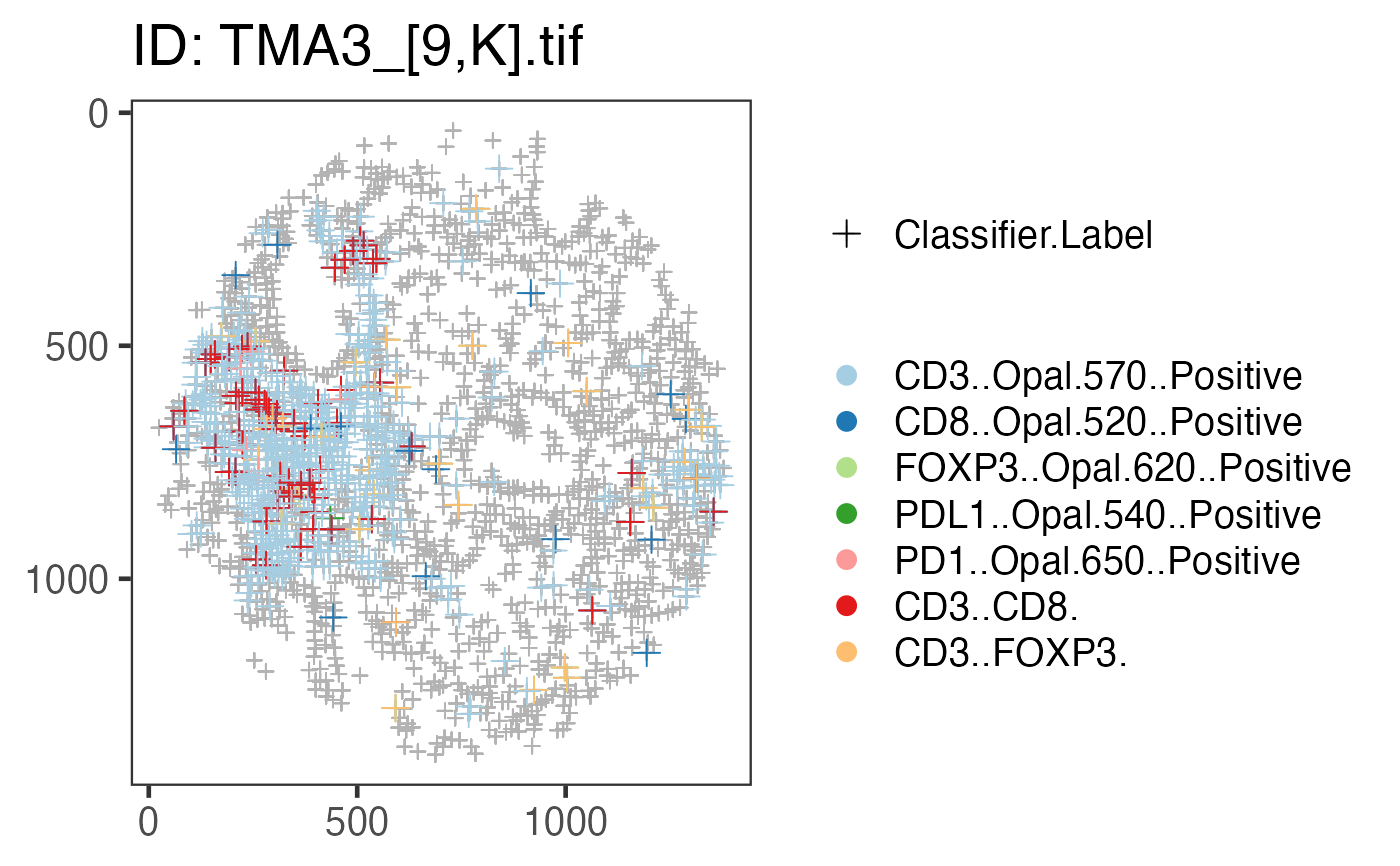
mnames_good <- c("CD3..Opal.570..Positive","CD8..Opal.520..Positive",
"FOXP3..Opal.620..Positive","PDL1..Opal.540..Positive",
"PD1..Opal.650..Positive","CD3..CD8.","CD3..FOXP3.")
x <- plot_immunoflo(x, plot_title = "deidentified_sample", mnames = mnames_good,
cell_type = "Classifier.Label")
#>
| | 0%, ETA NA
|============ | 20%, ETA 00:01
|======================== | 40%, ETA 00:01
|=================================== | 60%, ETA 00:00
|=============================================== | 80%, ETA 00:00
|=======================================================| 100%, Elapsed 00:01
x[["derived"]][["spatial_plots"]][[4]]