plot_counts: Generates plots for the distribution of counts
plot_counts.RdGenerates density plots, violin plots, and/or boxplots for the distribution of count values
plot_counts(
  x = NULL,
  samples = NULL,
  data_type = "tr",
  plot_type = "density",
  color_pal = "okabeito",
  cvalpha = 0.5,
  distrib_subset = 0.5,
  subset_seed = 12345
)
Arguments
- x
an STlist
- samples
samples to include in the plot. Default (NULL) includes all samples
- data_type
one of
trorraw, to plot transformed or raw counts- plot_type
one or several of
density,violin, andbox, to generate density plots, violin plots, and/or boxplots- color_pal
a string of a color palette from
khromaorRColorBrewer, or a vector with colors- cvalpha
the transparency of the density plots
- distrib_subset
the proportion of spots/cells to plot. Generating these plots can be time consuming due to the large amount of elements to plot. This argument provides control on how many randomly values to show to speed plotting
- subset_seed
related to
distrib_subset. Sets the seed number to ensure the same subset of values is selected for plotting
Value
a list of ggplot objects
Details
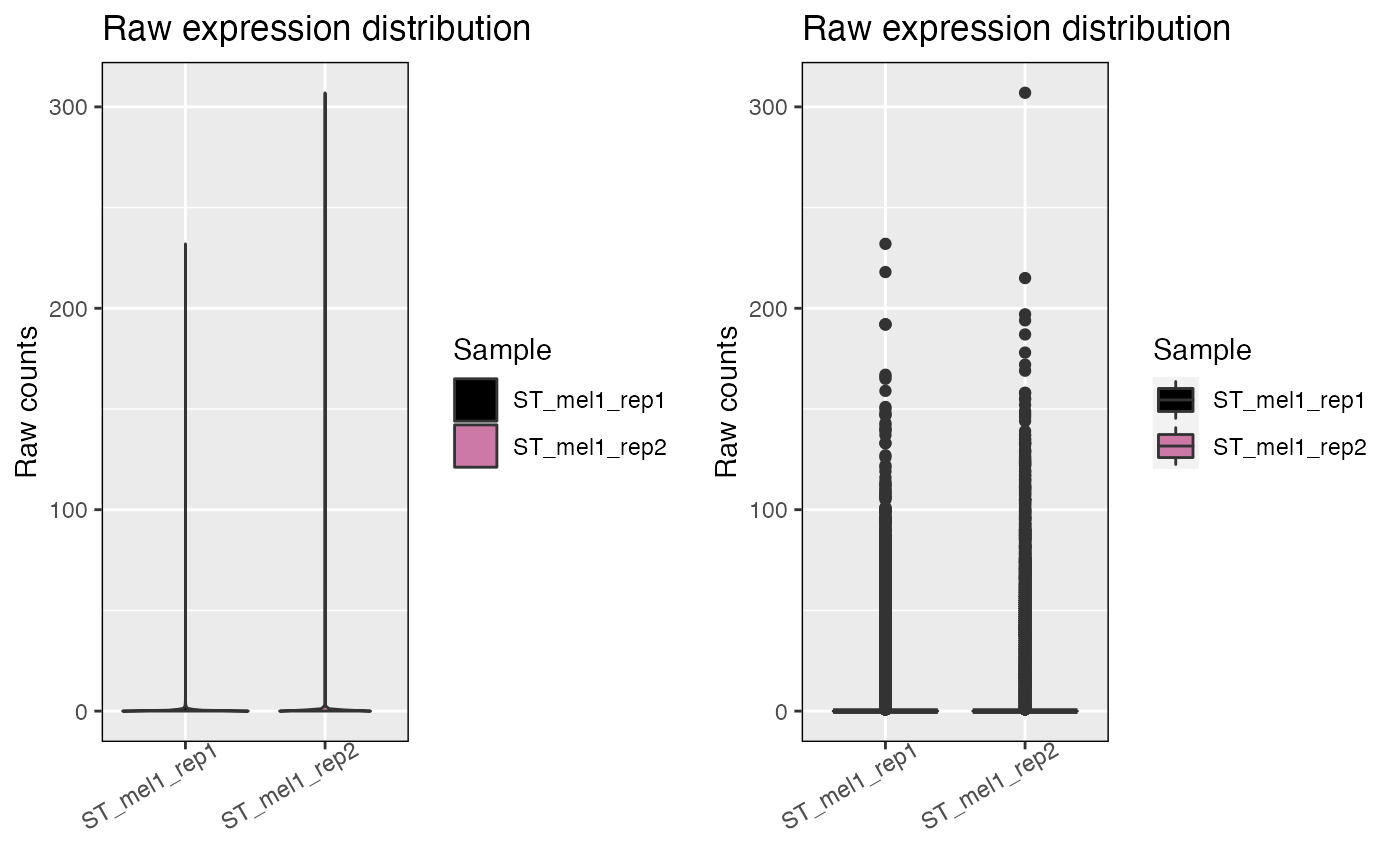
The function allows to visualize the distribution counts across all genes and spots
in the STlist. The user can select between density plots, violin plots, or box
plots as visualization options. Useful for assessment of the effect of filtering and
data transformations and to assess zero-inflation. To plot counts or genes per
spot/cell, the function distribution_plots should be used instead.
Examples
# Using included melanoma example (Thrane et al.)
# Download example data set from spatialGE_Data
thrane_tmp = tempdir()
unlink(thrane_tmp, recursive=TRUE)
dir.create(thrane_tmp)
lk='https://github.com/FridleyLab/spatialGE_Data/raw/refs/heads/main/melanoma_thrane.zip?download='
download.file(lk, destfile=paste0(thrane_tmp, '/', 'melanoma_thrane.zip'), mode='wb')
zip_tmp = list.files(thrane_tmp, pattern='melanoma_thrane.zip$', full.names=TRUE)
unzip(zipfile=zip_tmp, exdir=thrane_tmp)
# Generate the file paths to be passed to the STlist function
count_files <- list.files(paste0(thrane_tmp, '/melanoma_thrane'),
                          full.names=TRUE, pattern='counts')
coord_files <- list.files(paste0(thrane_tmp, '/melanoma_thrane'),
                          full.names=TRUE, pattern='mapping')
clin_file <- list.files(paste0(thrane_tmp, '/melanoma_thrane'),
                        full.names=TRUE, pattern='clinical')
# Create STlist
library('spatialGE')
melanoma <- STlist(rnacounts=count_files[c(1,2)],
                   spotcoords=coord_files[c(1,2)],
                   samples=clin_file) # Only first two samples
#> Warning: Sample ST_mel3_rep1 was not found among the count/coordinate files.
#> Warning: Sample ST_mel4_rep2 was not found among the count/coordinate files.
#> Found matrix data
#> Matching gene expression and coordinate data...
#> Converting counts to sparse matrices
#> Completed STlist!
cp <- plot_counts(melanoma, data_type='raw', plot_type=c('violin', 'box'))
ggpubr::ggarrange(plotlist=cp)