STplot_interpolation: Visualize gene expression surfaces
STplot_interpolation.RdProduces a gene expression surface from kriging interpolation of ST data.
STplot_interpolation(
  x = NULL,
  genes = NULL,
  top_n = 10,
  samples = NULL,
  color_pal = "BuRd"
)
Arguments
- x
an STlist containing results from
gene_krigefor the genes selected.- genes
a vector of gene names (one or several) to plot. If 'top', the 10 genes with highest standard deviation from each spatial sample are plotted.
- top_n
an integer indicating how many top genes to perform kriging. Default is 10.
- samples
a vector indicating the spatial samples to plot. If vector of numbers, it follows the order of
names(x@counts). If NULL, the function plots all samples- color_pal
a color scheme from
khromaorRColorBrewer.
Value
a list of plots
Details
This function produces a gene expression surface plot via kriging for one or several genes and spatial samples
Examples
# Using included melanoma example (Thrane et al.)
# Download example data set from spatialGE_Data
thrane_tmp = tempdir()
unlink(thrane_tmp, recursive=TRUE)
dir.create(thrane_tmp)
lk='https://github.com/FridleyLab/spatialGE_Data/raw/refs/heads/main/melanoma_thrane.zip?download='
download.file(lk, destfile=paste0(thrane_tmp, '/', 'melanoma_thrane.zip'), mode='wb')
zip_tmp = list.files(thrane_tmp, pattern='melanoma_thrane.zip$', full.names=TRUE)
unzip(zipfile=zip_tmp, exdir=thrane_tmp)
# Generate the file paths to be passed to the STlist function
count_files <- list.files(paste0(thrane_tmp, '/melanoma_thrane'),
full.names=TRUE, pattern='counts')
coord_files <- list.files(paste0(thrane_tmp, '/melanoma_thrane'),
full.names=TRUE, pattern='mapping')
clin_file <- list.files(paste0(thrane_tmp, '/melanoma_thrane'),
full.names=TRUE, pattern='clinical')
# Create STlist
library('spatialGE')
melanoma <- STlist(rnacounts=count_files[c(1,2)],
spotcoords=coord_files[c(1,2)],
samples=clin_file) # Only first two samples
#> Warning: Sample ST_mel3_rep1 was not found among the count/coordinate files.
#> Warning: Sample ST_mel4_rep2 was not found among the count/coordinate files.
#> Found matrix data
#> Matching gene expression and coordinate data...
#> Converting counts to sparse matrices
#> Completed STlist!
melanoma <- transform_data(melanoma)
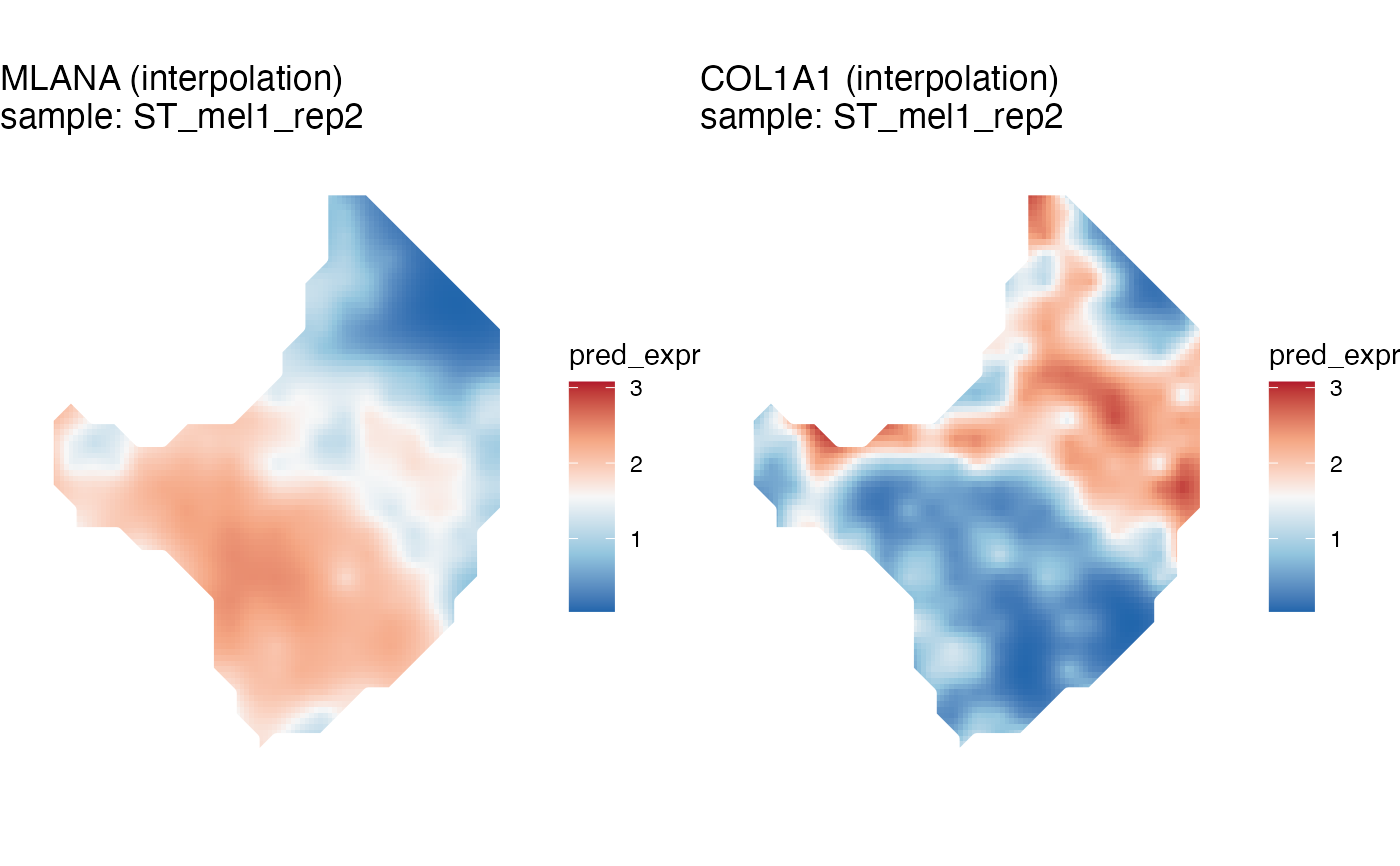
melanoma <- gene_interpolation(melanoma, genes=c('MLANA', 'COL1A1'), samples='ST_mel1_rep2')
#> Gene interpolation started.
#> Warning: No convergence after 200 iterations: try different initial values?
#> [using ordinary kriging]
#> [using ordinary kriging]
#> Gene interpolation completed in 0.01 min.
kp = STplot_interpolation(melanoma, genes=c('MLANA', 'COL1A1'), samples='ST_mel1_rep2')
ggpubr::ggarrange(plotlist=kp)