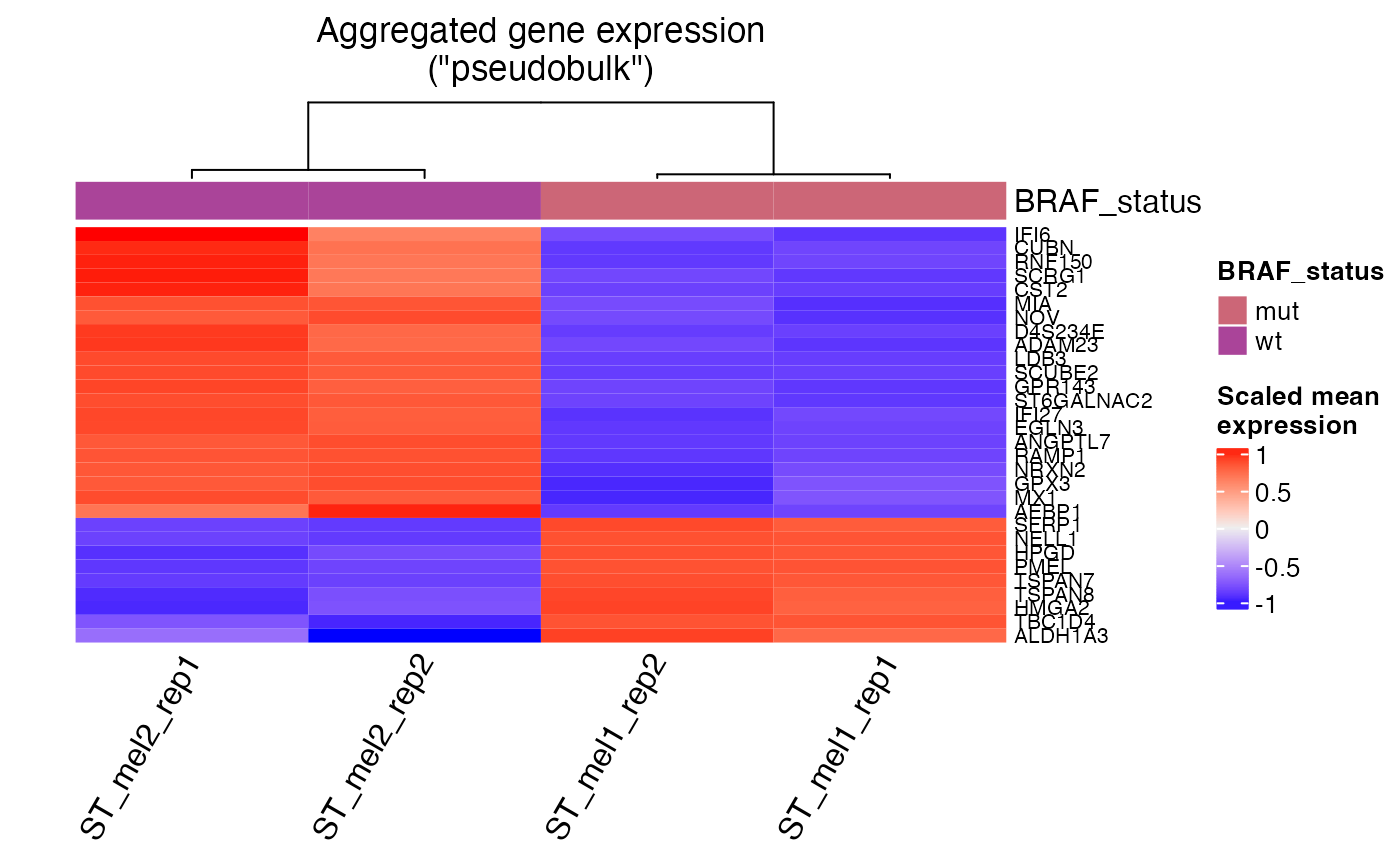
pseudobulk_heatmap: Heatmap of pseudobulk samples
pseudobulk_heatmap.RdGenerates a heatmap plot after computation of "pseudobulk" counts
pseudobulk_heatmap(
  x = NULL,
  color_pal = "muted",
  plot_meta = NULL,
  hm_display_genes = 30
)
Arguments
- x
an STlist with pseudobulk counts in the
@miscslot (generated bypseudobulk_samples)- color_pal
a string of a color palette from khroma or RColorBrewer, or a vector of color names or HEX values. Each color represents a category in the variable specified in
plot_meta- plot_meta
a string indicating the name of the variable in the sample metadata to annotate heatmap columns
- hm_display_genes
number of genes to display in heatmap, selected based on decreasing order of standard deviation across samples
Value
a ggplot object
Details
Generates a heatmap of transformed "pseudobulk" counts to help in initial data
exploration of differences among samples. Each column in the heatmap represents a
"pseudobulk" sample. Rows are genes, with the number of genes displayed controlled by
the hm_display_genes argument. This function follows after usage of pseudobulk_samples.
Examples
# Using included melanoma example (Thrane et al.)
# Download example data set from spatialGE_Data
thrane_tmp = tempdir()
unlink(thrane_tmp, recursive=TRUE)
dir.create(thrane_tmp)
lk='https://github.com/FridleyLab/spatialGE_Data/raw/refs/heads/main/melanoma_thrane.zip?download='
download.file(lk, destfile=paste0(thrane_tmp, '/', 'melanoma_thrane.zip'), mode='wb')
zip_tmp = list.files(thrane_tmp, pattern='melanoma_thrane.zip$', full.names=TRUE)
unzip(zipfile=zip_tmp, exdir=thrane_tmp)
# Generate the file paths to be passed to the STlist function
count_files <- list.files(paste0(thrane_tmp, '/melanoma_thrane'),
                          full.names=TRUE, pattern='counts')
coord_files <- list.files(paste0(thrane_tmp, '/melanoma_thrane'),
                          full.names=TRUE, pattern='mapping')
clin_file <- list.files(paste0(thrane_tmp, '/melanoma_thrane'),
                        full.names=TRUE, pattern='clinical')
# Create STlist
library('spatialGE')
melanoma <- STlist(rnacounts=count_files,
                   spotcoords=coord_files,
                   samples=clin_file, cores=2)
#> Found matrix data
#> Matching gene expression and coordinate data...
#> Converting counts to sparse matrices
#> Completed STlist!
melanoma <- pseudobulk_samples(melanoma)
hm <- pseudobulk_heatmap(melanoma, plot_meta='BRAF_status', hm_display_genes=30)