pseudobulk_samples: Aggregates counts into "pseudo bulk" samples
pseudobulk_samples.RdAggregates spot/cell counts into "pseudo bulk" samples for data exploration
pseudobulk_samples(x = NULL, max_var_genes = 5000, calc_umap = F)Arguments
Value
an STlist with appended pseudobulk counts and PCA coordinates
Details
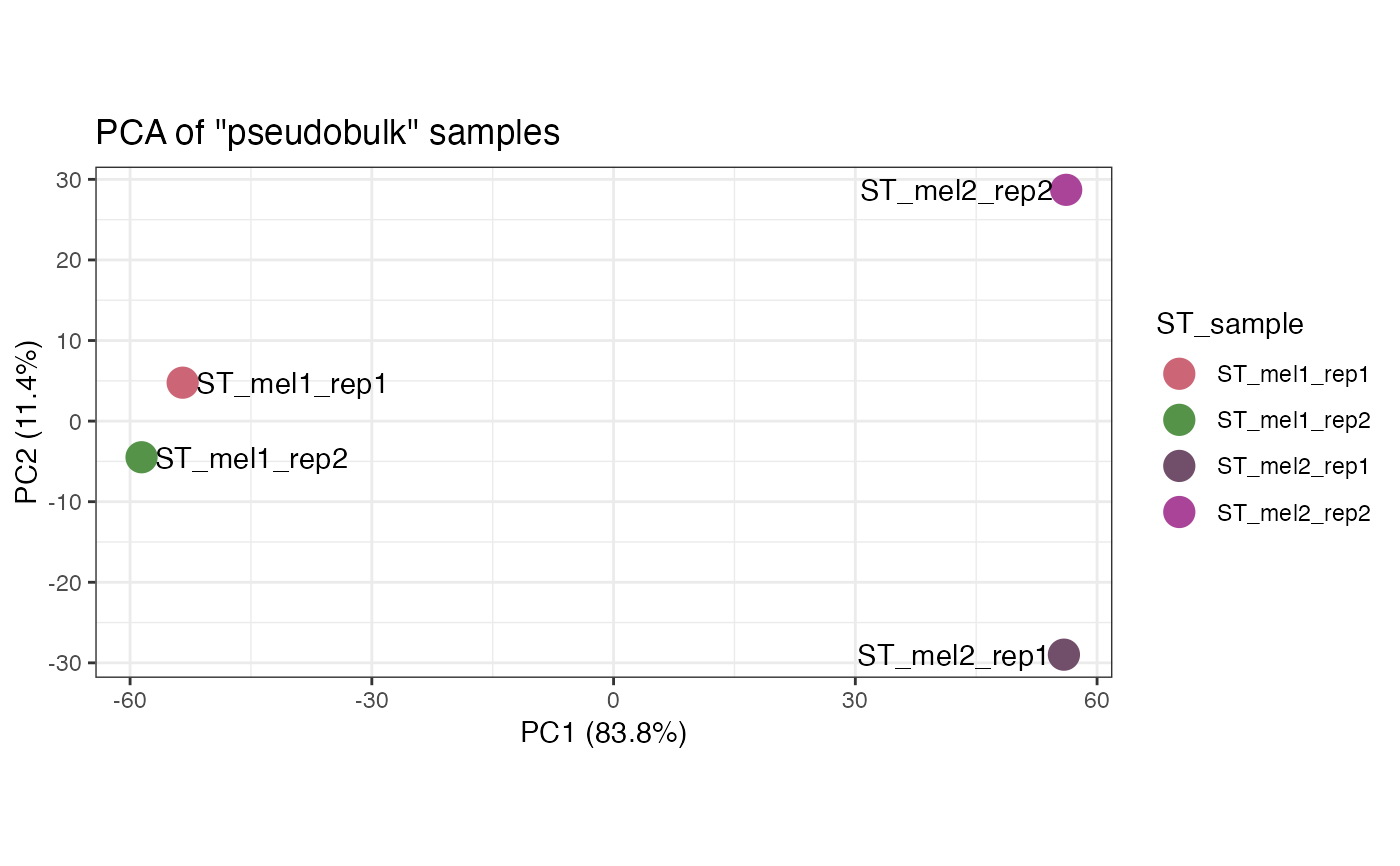
This function takes an STlist and aggregates the spot/cell counts into "pseudo bulk" counts by summing all counts from all cell/spots for each gene. Then performs Principal Component Analysis (PCA) to explore non-spatial sample-to-sample variation
Examples
# Using included melanoma example (Thrane et al.)
# Download example data set from spatialGE_Data
thrane_tmp = tempdir()
unlink(thrane_tmp, recursive=TRUE)
dir.create(thrane_tmp)
lk='https://github.com/FridleyLab/spatialGE_Data/raw/refs/heads/main/melanoma_thrane.zip?download='
download.file(lk, destfile=paste0(thrane_tmp, '/', 'melanoma_thrane.zip'), mode='wb')
zip_tmp = list.files(thrane_tmp, pattern='melanoma_thrane.zip$', full.names=TRUE)
unzip(zipfile=zip_tmp, exdir=thrane_tmp)
# Generate the file paths to be passed to the STlist function
count_files <- list.files(paste0(thrane_tmp, '/melanoma_thrane'),
                          full.names=TRUE, pattern='counts')
coord_files <- list.files(paste0(thrane_tmp, '/melanoma_thrane'),
                          full.names=TRUE, pattern='mapping')
clin_file <- list.files(paste0(thrane_tmp, '/melanoma_thrane'),
                        full.names=TRUE, pattern='clinical')
# Create STlist
library('spatialGE')
melanoma <- STlist(rnacounts=count_files,
                   spotcoords=coord_files,
                   samples=clin_file, cores=2)
#> Found matrix data
#> Matching gene expression and coordinate data...
#> Converting counts to sparse matrices
#> Completed STlist!
melanoma <- pseudobulk_samples(melanoma)
pseudobulk_dim_plot(melanoma)