pseudobulk_pca_plot: Plot PCA of pseudobulk samples
pseudobulk_pca_plot.RdGenerates a PCA plot after computation of "pseudobulk" counts
pseudobulk_pca_plot(
  x = NULL,
  color_pal = "muted",
  plot_meta = NULL,
  pcx = 1,
  pcy = 2,
  ptsize = 5
)
Arguments
- x
an STlist with pseudobulk PCA results in the
@miscslot (generated bypseudobulk_samples)- color_pal
a string of a color palette from khroma or RColorBrewer, or a vector of color names or HEX values. Each color represents a category in the variable specified in
plot_meta- plot_meta
a string indicating the name of the variable in the sample metadata to color points in the PCA plot
- pcx
integer indicating the principal component to plot in the x axis
- pcy
integer indicating the principal component to plot in the y axis
- ptsize
the size of the points in the PCA plot. Passed to the
sizeaesthetic fromggplot2
Value
a ggplot object
Details
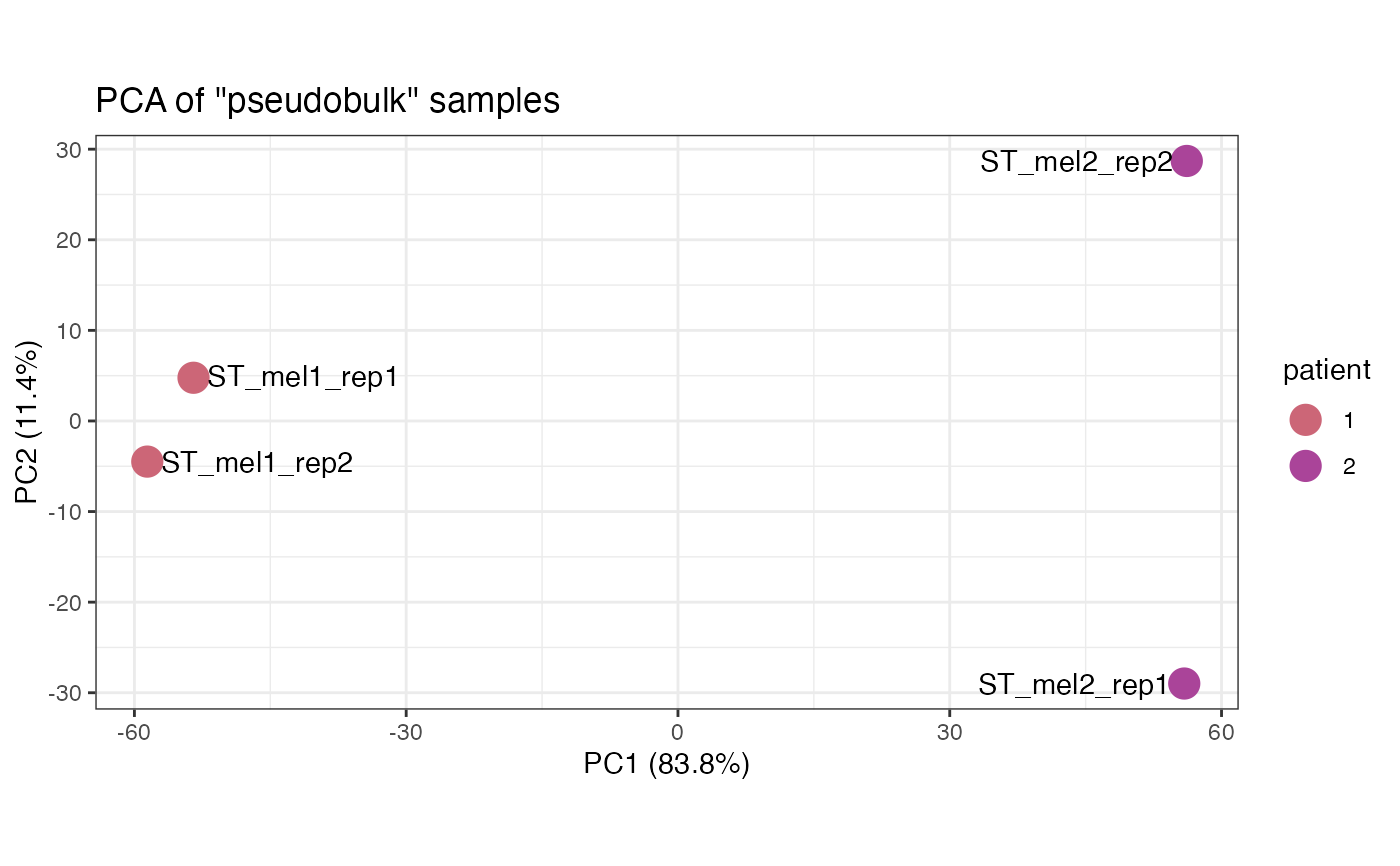
Generates a Principal Components Analysis plot to help in initial data exploration of
differences among samples. The points in the plot represent "pseudobulk" samples.
This function follows after usage of pseudobulk_samples.
Examples
# Using included melanoma example (Thrane et al.)
library('spatialGE')
data_files <- list.files(system.file("extdata", package="spatialGE"), recursive=T, full.names=T)
count_files <- grep("counts", data_files, value=T)
coord_files <- grep("mapping", data_files, value=T)
clin_file <- grep("thrane_clinical", data_files, value=T)
melanoma <- STlist(rnacounts=count_files[c(1:4)], spotcoords=coord_files[c(1:4)], samples=clin_file) # Only first two samples
#> Warning: Sample ST_mel3_rep1 was not found among the count/coordinate files.
#> Warning: Sample ST_mel3_rep2 was not found among the count/coordinate files.
#> Warning: Sample ST_mel4_rep1 was not found among the count/coordinate files.
#> Warning: Sample ST_mel4_rep2 was not found among the count/coordinate files.
#> Found matrix data
#> Matching gene expression and coordinate data...
#> Converting counts to sparse matrices
#> Completed STlist!
#>
melanoma <- pseudobulk_samples(melanoma)
pseudobulk_pca_plot(melanoma, plot_meta='patient')